
I received a lovely book as a birthday gift from a friend whom I told once I was so keen to get myself a copy but couldn't afford at that time. Authored by a father-daughter duo, they are more than simple enthusiast for reproducing some of the greatest work in 20th century physics. Exploring Quantum Physics through Hands-on Projects really provides all the little ideas (and some not so little) for the home-experimenter to verify some of the important works in physics which has earned its pioneers their Nobel prize.
In this article, I'll give an account of an experiment I've done according to that was described in chapter 4. The basic principle discussed was quantization which the authors called "the core for quantum physics". In it, they described a simple but effective "visualization" of Planck's constant at work using LED of different colours.
.jpg)
A simple circuit can visualize Planck's constant at work - proving quantization as part of nature's behavior.
The theory suggest that a single coloured LED (not white) emit almost (but not quite) monochromatic light. Assuming they do, the energy required to generate particles of light (photons) streaming out of the LED, have energy described by simple equation:
E = hf = (hc)/wavelength , c is speed of light in vacuum
Which states the energy, E, of a single particle of light is directly proportional to its frequency under a physical constant called the Planck's constant, h.
Now because the colour of light is associated with its wavelength (and hence frequency), not surprising it will require increasing amount of energy to power LED that generates light with short wavelength (or high frequency). The Prutchi duo indeed suggest the constant h can be approximated by measuring the wavelength (or frequency) of light and voltage required to "start" LEDs. This is only true by assuming the energy of the photon is a direct consequence of the electrons transit from a higher level to a lower level corresponding to the materials inside the LED:
eV = hf = (hc)/wavelength , assuming E = eV
where e is the charge of an electron and V is the voltage required to "switch on" the LED.
I have five LED of different colour which I have their wavelength measured using an Ocean Optics USB spectrometer. The results were normalized for all the LED emissions and graphically represented below:

The spectral profile of LEDs. They emit light with one peak wavelength corresponding to their colour.
Specifically, the spectral emission peaks are 631 nm, 595 nm, 561 nm, 527 nm and 456 nm giving uncertainty of 2 nm for spectrometer calibration. The wavelengths correspond to their appearance: red, orange, yellow-green, green and blue respectively.
By connecting the LED in series with a potentiometer powered by a 9 V battery, the "switch on voltage" can be measured by placing a multimeter probe between the LED electrodes while adjusting the potentiometer such that the LED start to emit light.
When I did the experiment, I found a major flaw in its argument. The authors of the book themselves explained that this method can only approximate the constant h due to the very nature of LED themselves. To say light emitted from electron transition due to externally applied electric potential inside the "active region" of the LED is an oversimplification of the real case.
1. The emission of light, as I found, happens even in as low as 0.07 V. As long as the LED is properly connected to their terminals (sign not reversed), a slight potential difference across it will cause a tiny current flowing through the diode which cause it to emits light.
2. When the voltage is increased to about 1 V, the LED gets progressive brighter and at 1.75 V for LED designated "red", the brightness suddenly increased indicating "switching on". This sudden "switch on" voltage varies with LED of different colour and it is the parameter which we measure.
The two points above actually describes the character of a semiconductor diode which I will not explain its operating mechanism in detail. Briefly, the wavelength of light emitted is actually dependent on the band-gap energetics of the materials between a p-n junction. The voltage I measured was actually the "forward bias voltage drop, Vd" corresponding to the point when the voltage-current curve starts to exhibit exponential behavior.
.jpg)
Photograph taken by myself showing the "active region" in a green LED. Notice the tiny bright cubic crystal sitting on the reflective cavity supported by the cathode anvil "flag". Two thin wires connects the crystal are the cathode and anode providing energy (electric potential) to create light.
Nevertheless, I tabulated the data and plot a graph that include both a "theoretical" computation assuming [eV = (hc)/wavelength] and "experiment" points:
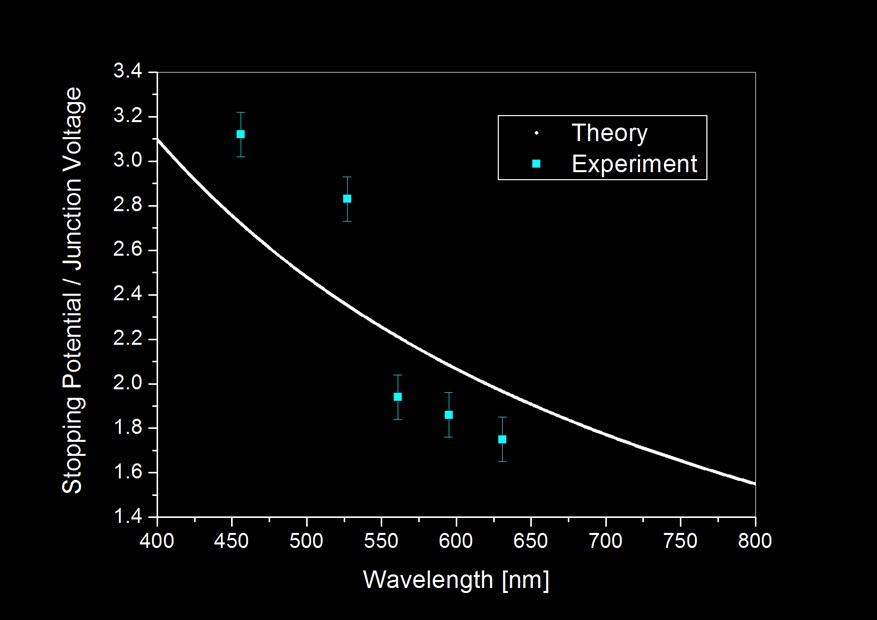
Notice how far the experiment results deviates from theory which assumes energy needed to generate light, E = eV even after including measurement uncertainties. But because 5 experiment points cannot statistically justify the trend, I calculated the Planck's constant, h, based on the result obtained from the 5 LEDs.

The average turns out actually not bad when compared to the actual value of Planck's constant: 6.626E−34 Js. Which differs only about 0.2% considering an experiment based on so many assumptions. It need to be noted that this apparently "good" result is also derived from statistics (since we averaged it), so given if we have more LEDs which emits light in wavelength other than the five I currently have, the "new" averaged result might not be so beautiful.
This experiment tells us one important thing: that quantization of energy in the form of light, is detectable even in a slightly complicated solid-state system such as the LED. Different colours of light indicated by its frequency regardless of where it comes from, whether from our star, the lamp in our house to the screen we touch can be regarded as little "packets" of energy emitted from them. Each little "packet" is an energy signature that is in the multiple of Planck's constant. They typically enters our eye in huge numbers having different energy individually for different colours. These little particles or "corpuscles" as Sir Isaac Newton calls it, brought us a beautiful universe through a sensory perception we call sight.
1 comment:
We first developed this demonstration in 1973. Glad it's still in use. The idea that LED's that 'light up' (admittedly not an absolute measurement) at 1.6 volts emit 1.6 ev photons and similarly for other colors and voltages was the inspiration for the demo we did at the American Association of Physics Teachers at Argonne Labs.
There's been quite a bit of refinement since then, in the procedures needed to get more certain results, but it's still the same demo. in its essence. Thanks for the write-up.
Patrick J. and Leah R. O'Connor retired physics teachers
Post a Comment