Search this blog!

Showing posts with label Light. Show all posts

13 April 2014

DC Atmospheric Nitrogen Discharge: Dye Fluorescence

I have been keeping these photo for some time now waiting for the completion of discharge spectra thermal analysis. Since I have been taking forever to do so thanks to the complexity of molecular spectrum; these two photos has been a constant annoyance on my desktop - a reminder of an incomplete work. I have finally decided to release it with some brief information. 

Figure 1: Homemade halogen lightbulb transformer driven flyback DC high-voltage source energizing a multimeter probe. UV emission from corona discharge excites blue fluorescence on paper.

The photo above shows a metallic multimeter probe I've energized with positively rectified high-voltage from a vintage flyback transformer driven by a 12 V halogen lamp high-frequency digital "transformer". Under such high electrical tension, the vertex of the sharp tip have the highest charge density with electric field strength significantly stronger than the dielectric breakdown value of air ~3 million V/m [1, 2]. This causes the tip to glow purple from corona discharge followed by simultaneous release of ozone gas (distinctive musty smell) from the breakdown of oxygen molecules.

Right below the metal tip is a piece of paper acting as electric ground, attracting the positive ions spraying out from the metal tip subsequently causing the paper to glow blue from fluorescence (paper fluoresce because "optical brighteners" has been added). This whole set up was taken with an exposure time of 0.5 second to reveal the corona discharge. The multimeter probe was illuminated briefly by a white L.E.D to cast a shadow, indicating the tip is at a distance away from the paper. 

Figure 2: Vibration energy level of  nitrogen molecule [3]. Major emission lines indicated by red arrow. 

Unfortunately before I am able to measure the output voltage accurately, my last attempt to generate high voltage with similar set-up has resulted permanent damage in the secondary winding of the flyback transformer. My guess is that it has an open-circuit potential around + 20 kV estimated simply based on sharp tipped spark gap distance of 25 mm. The damage was most likely contributed by high current draw (far exceeding 1 mA) without a current-limiting resistor in series with the load (I hooked it up directly to a glow discharge tube) causing a meltdown somewhere within its fine wire coils. 

The lesson: use a ballast resistor for any sort of load.

Figure 3: Emission spectrum of corona discharge. More than 90% light emitted are UVA radiation.

Figure above is the actual dark compensated, 3-second exposure spectrum of the corona discharge taken with OceanOptics USB4000 spectrometer. Even at 3 second exposure (instrumental limit) the data still appears noisy. It was definitely weak light to be picked up by the human eye but the spectrum certainly features at least four peaks within 300 to 400 nm falling under A-subtype UV radiation (keep in mind that ultraviolet light is invisible). 

The four relatively bright emission have wavelengths slightly shorter than peak emission from violet L.E.D but they are less harmful to the eyes compared to emissions from germicidal lamp. All four spectral lines correspond to the second positive system N2 C → B (vibration bands) of atmospheric nitrogen molecules. More specifically for 337 nm line (important because it will be featured in TEA superluminal sources), the vibration level responsible for the transition is N2 (C3Π+u, v'=0) → (B3Π+g, v"=0) of the second positive system [4].

Figure 4a (top): Two glass vials on paper holding water suspension of highlighter pigments, left and right are blue and yellow respectively. Figure 4b (bottom): Long exposure photography shows yellow highlighter dye fluoresce while blue dye remains dark. Notice the blue fluorescence of paper under UVA irradiation.

Now, without anymore further discussions available, I bring up an experiment from the past dealing with fluorescence of highlighter pigments. Earlier, I have tested the dyes and found out the blue highlighter dye does not fluoresce under violet L.E.D. I thought probably light with wavelength shorter than 390 nm might do the work, so I tested the blue dye with UVA emissions of a corona discharge. Not surprisingly, the blue still shows negative response.


REFERENCE
[1] Tipler, Paul A., "College Physics", Worth, 1987, pp.467
[2] Rigden, John S., "Macmillan Encyclopedia of Physics", Simon and Schuster, 1996, pp.353
[3] F. Arqueros, F. Blanco, F. Rosado, "Analysis of the Fluorescence Emission of Atmospheric Nitrogen by Electron Excitation and its Application to Fluorescence Telescopes", New J. Phys., 2009, pp.11
[4] H. Khatun, A.K. Sharma, P.K. Barhai, "Experimental Study of Low-Pressure Nitrogen Dielectric Barrier Discharge", Braz. J. Phys., Vol.40, No. 4, 2010, pp.450 

19 February 2014

Crude Plasma Diagnostics for UVC Germicidal Lamp

* This article is closely associated with a previous entry. The author assumes reader understand basic definition of physical plasma as the fourth state of matter.

Figure 1: Applying magnetic field towards the plasma causes its shape to distort due to Lorentz force acting on moving charged particles.

It was a while ago I took a spectrum of the UVC germicidal lamp without its waterproof quartz glass. Its discrete sharp peaks can be described by hallmark of the old quantum theory - light emitted due to electronic transitions between discrete energy levels within the gaseous atoms contained inside the tube. Within the past hundred years, physicists has worked out many useful formulae to relate measurable parameters of a gas discharge spectra such as intensity and its associated wavelength with physical mechanisms that is happening inside the tube at the atomic level. Here, I have worked out some crude but important characterization of the plasma when the UVC germicidal lamp is energized.

Figure 2: Spectrum of UVC germicidal lamp with tagged wavelengths for 17 strong peaks 

After plotting the numerical data into a spectrum (above), I have listed down the wavelength and intensity for 27 individual peaks which I had identified its origin thanks to NIST online database. Interestingly, the peaks was the "fingerprint" of not one but two different chemical elements (as low pressure gas) inside the tube. As mentioned in previous post, the beautiful cyan glow and strong UVC emission at 253.7 nm are the principal character of electrically excited low pressure mercury-vapour, hence finding peaks corresponding to mercury atoms is not surprising. The second interesting element was argon which I presume it was the "filler" noble gas when they used to purge the tube before vacuuming down and filling it up with a small quantity of mercury vapour. All the peaks are of neutral, i.e. Hg (I) and Ar (I) atoms.

Out of 27 peaks, 10 belongs to Hg (I) transitions while the rest are Ar (I). Finding the peaks was easy with common graphing tool (I used Origin 7.0). To make further analysis clear, I shall begin by separating this study into a few components:

1. Calculation of Electron Temperature via Boltzmann Plot
2. Voigt Profile Fitting of Spectral Peak to Determine Broadening Mechanism
3. Estimation of Plasma (absolute) Temperature
4. Comparing Peak Intensity Ratio for Self-Absorption Mechanism
5. Conclusion on Plasma Diagnostics With Respect To Electrical Characteristics

ELECTRON TEMPERATURE AND BOLTZMANN PLOT

You can think of plasma as a "hot soup" of randomly colliding electrons and ions. The electron temperature of plasma allows us to gauge the "hotness" or more specifically the statistical kinetic energy of electrons bumping randomly to each other. Because electrons are so much lighter compared to ions, they transfer energy in different rates when they collide with ions than itself. As such, for the value of electron temperature to stay valid, it is important that the plasma have reached a state where all its particles, i.e. electrons, atoms and ions has reached a common temperature known as Local Thermal Equilibrium (LTE). Otherwise, this physical quantity is known as "excitation temperature".

This temperature can be calculated through the famous Boltzmann plot. In essence, it assumes two emission energy levels of the same atomic population, Ei and Ek are in thermal equilibrium at temperature T, given by:

Equation 1

where N1 and N2 denotes number density and g1 and g2 are the statistical weights respectively. The total number density (I skipped a few algebraic derivation steps) can be simplified to:

Equation 2

At LTE, the intensity for each spectral peak is given by:

 Equation 3

where Aji is the Einstein coefficient for upper transition probability. Rearranging equation 3 by taking natural logarithm on both sides for linearising the expression (y = mx+c) we arrive at:

Equation 4

where the gradient, (-1/kT) tells the electron temperature T, of the plasma. This is the Boltzmann plot where the x and y parameter of this linear expression can be obtained both experimentally (intensities and wavelengths) and from NIST standards (energy levels, Einstein coefficients and statistical weights). 

One interesting outcome for plotting this is that from the data points is that we can determine if the spectrum is "optically thin" through the degree of linearity, i.e. the points coincide a straight line. Optically thick spectra is typically associated with dense plasma where some part of its light has been re-absorbed into the plasma itself, rendering the spectra unreliable for temperature analysis. From tedious work finding all the parameters for Boltzmann plot, I managed to do it for both mercury and argon:

Figure 3: Boltzmann plot for argon lines (top) and mercury lines (bottom). While the data is chaotic for argon's case, data for mercury seems to exhibit linearity where the expected gradient enables calculation of the electron temperature. 

Even though argon has 17 emission lines, it is immediately obvious that the Boltzmann plot for argon lines yields chaotic results for a linear fit. Fortunately, there seems to be a linear relationship for mercury lines and I have used a linear fitting software which gave me a gradient of -1.43 with error of 0.35. This yields electron temperature at (0.699 ± 0.37) eV that is 8112 K for people not in plasma physics and 8384.7 degrees Celsius for non-physicists. The temperature is in the order of magnitude similar to discharge lamps reported in various literature elsewhere. 

PEAK PROFILE FOR BROADENING MECHANISM

The spectrum for plasma (refer to figure 2) contains discrete sharp peaks which I have briefly mentioned as the result of electronic transitions within trillions of atoms of the gas contained in the germicidal lamp. Following the quantum theory, ideally for each electronic transition, the atom emits one particle of light, the photon, with a fixed wavelength and should result an infinitely thin line. However, experiments should find that no matter how "pure" a plasma is, we will always see the peak profile having a broadened "waist", like a mountain. So what was broadening it? 

Broadly, there are three primary mechanisms causing this effect here listed with decreasing significance:

1. Doppler effect coming from light emitted from moving particles within the plasma which reveal itself as spectral line with a Gaussian profile.
2. Stark effect coming from energy levels (especially those close to the continuum) of an atom being "disturbed" by electric fields of nearby moving ions and/or externally applied E-field, this effect reveal itself in spectral line of Lorenzian profile. 
3. Intrinsic property of quantum mechanics itself. i.e. the Heisenberg Uncertainty Principle, which states that any electrically excited atoms having a finite lifetime will have slight indeterminate energy level, causing the light emitted from atoms having so slightly a shorter or longer wavelengths with one another. An effect I believe too insignificant to observe based on the resolution of our experiment set-up.

For simplicity sake, I have chosen the brightest peak of the spectrum, i.e. the line at 253.7 nm for profile analysis. As we magnify the wavelength scale, we will see the "line-like spike" resolve into a "mountain". There are a few types of fitting available to extract information regarding its shape. For further analysis, I used a combination of both Gaussian and Lorenzian profile fitting - the Voigt profile. 

Figure 4: Voigt profile fitting for the brightest spectral peak at 253.7 nm. Red line indicates the fitting.

Using a Voigt fitting, Origin 7 provides me two w parameters for defining the typology of the "mountain" shape. A ratio of wG and wL (0.00381/1.91006) gives us 0.002 which is significantly less than 0.5 - the threshold for Lorenzian profile, so Gaussian it is.      

Figure 5: First order derivative of fitted Voigt profile. The peaks enables calculation of FWHM value.

Identifying the peak having a Gaussian profile has an advantage. Other than confirming the dominant broadening mechanism as the result of Doppler effect, a simple equation based on Maxwellian distribution can be used to estimate the absolute temperature of the plasma by knowing the profile's full wave half maximum (FWHM) value. We will discuss that in the next sub-chapter but for the moment, I have worked out the FWHM via first order derivative of said Voigt profile. 

The positive and negative peaks of Voigt derivative correspond to the half-width value Δλ1/2, where |254.28 - 252.51| = 1.77 nm.   

ESTIMATION OF PLASMA TEMPERATURE 

As mentioned before, to characterize a plasma which composed of different types of particles, have to account two different temperatures. While we have characterized the electron temperature with Boltzmann plot, there is another class of particles - ions, which are heavier and moves slower relative to electrons and their temperature can be related to the absolute temperature of the plasma based on FWHM for Doppler broadening given by:

Δλ1/2 = 2λ SQRT (2kT ln 2 / mc^2)
Equation 5

where λ is the peak wavelength, m is the atomic mass and c is the speed of light. T is the absolute temperature where by rearranging the equation, I have calculated it to be 1.84E10 degree Kelvin. Which is rather nonsensical. For comparable results with our previously obtained electron temperature (plasma temperature should be slightly "less hotter" than electron temperature but LTE demands them to be as close as possible) the FWHM value should be in the order of 0.001 nm, which is far beyond the resolving capabilities of my spectrometer set-up. 

I would argue such absurdities are due to equation 5, which depends heavily on the FWHM value which was limited experimentally by my spectrometer slit width, not until we analyze FWHM for each 27 peaks using precision spectrometer (which is quite a lot of work), I cannot be convinced that the absolute temperature falls in that order of magnitude. Naturally, because the plasma temperature differs so greatly with the electron temperature, I cannot conclude the plasma is even in LTE. 

PEAK INTENSITY RATIO FOR SELF-ABSORPTION MECHANISM

There is however another way to determine the "usability" of the spectrum by finding its optical "thickness" with experimental intensity ratio between two emission lines that has the same upper energy level, described by:

Equation 6

we can eliminate the exponential term since E2 = E1, and therefore leads to: 

Equation 7

where the left hand side (L.H.S) can be obtained via experiment intensity and right hand side (R.H.S) through NIST standards. With that, I have came to using three Hg (I) lines of 404.11 nm, 435.34 nm and 545.94 nm having identical upper energy level at 62350.325 cm^-1 corresponding to electron shell 3s at 5d(10)6s7s configuration, calculated their LHS and RHS values to be 2.57 against 1.43 and 3.57 against 2.46. Both differ by at least 1.1 suggesting optically thick plasma. This can be interpreted as self-absorption of photons by the atoms inside the plasma and the rate of absorption differs between different spectral lines depending on factors like energy level lifetime and charge densities etc.

CONCLUSION

To be honest, eventually diagnosing the plasma as optically thick was rather disappointing considering the amount of work spent on gathering spectral data from NIST and the associated analysis. Nonetheless we learned that the plasma confined within the germicidal lamp's quartz tube contains argon. Even though no conclusion can be drawn on the state of LTE for the plasma, the electron "excitation" temperature was found to be in the order of magnitude expected for a discharge lamp, that is at around 8000 K based on Boltzmann plot. The plasma temperature was found to be in the order of 10,000,000,000 K is unrealistic, but it was due to experimental limitation vis-a-vis the design of the spectrometer (thus limiting the FWHM resolution). It could also be due to some other broadening mechanisms which I have overlooked. 

On optical thickness, I am tempted to suggest the difference between LHS and RHS terms from equation 7 arise from self-absorption are due to the electrical characteristics of the plasma. The germicidal lamp is most probably energized by alternating voltages which cause the particles in the plasma to "move" differently when it is energized by static DC sources. To understand these character of a plasma in detail, I recommend further work on a system that enables me to fix the state of vacuum and gas inside a chamber where we can manipulating the electrical properties of plasma to study its spectral changes although such work will be painstakingly time consuming. 


REFERENCES
[1] N.M. Shaikh, B. Rashid, S. Hafeez, Y Jamil and M.A. Baig, "Measuremement of Electron Density and Temperature of Laser Induced Zinc Plasma", 2006, J. Phys D: Appl. Phys., pp.1384
[2] C. Aragon, J.A. Aguilera, "Characterization of Laser Induced Plasmas by Optical Emission Spectroscopy: A Review of Experiments and Methods", 2008, Spectrochimica Acta B, pp.893
[3] A.D.Giacomo, V.A.Shakhatov, O.De Pascale, "Optical Emission Spectroscopy and Modeling of Plasma Produced by Laser Ablation of Titanium Oxides", 2001, Spectrochimica Acta B, pp.753

9 December 2013

Germicidal Lamps: Optical Properties and Hazards

So about two weeks ago, I came across this pet shop which sells some inexpensive ultraviolet water sterilizer for the purpose of disinfecting water supply for display aquariums. For MYR 50, I got a short-tube 17 cm in length, rated 11 watts germicidal lamp (photograph below)

water sterilizer mercury-vapour shortwave ultraviolet lamp: quartz enclosure 

A product of China, the package briefly mentioned its hazard for "unseen" radiation emitting from these lamps when energized. It takes first hand experience to truly feel the intrinsic danger of using these lamps without proper protection. Before I go into that, lets take a look on the design of germicidal lamps. 

Germicidal lamps are basically mercury-vapour fluorescent lamps we can find in our house or offices without the white phosphor coating. Typically lighting up fluorescent lamp emits visible light but together with it, substantial amount of radiation are emitted in the ultraviolet (UV) range. Fortunately most of it especially the "harmful ones" are blocked by the phosphor powder and glass tubing itself. Germicidal lamps however utilize particularly these UV radiation emitted from energized mercury-vapour to kill microorganisms and so instead of glass, which absorbs or "block" UV radiation, the tube was constructed out of fused quartz to allow these UV radiation to escape. This light, in the range of the so called C-subtype ultraviolet radiation (UVC at 280-100 nm) or also known as shortwave UV can be easily absorbed by bio-molecules (especially DNA) within microorganisms or cells, breaking its molecular bonds and thus "disable" or perhaps destroy its structure and thus the organism. 

Emission spectra of germicidal lamp (black) and shielded light with 2 mm thick glass sheet (red)

Using a commercial USB input spectrometer, I have recorded here the emission spectrum of my germicidal lamp (image above). The two sets of data corresponds to emission spectra for non-shielded germicidal lamp light-source (black line) and spectra for light shielded with a sheet of 2 mm thick soda-lime glass. There are a few important points we can extract from the spectra above. 

For one, we know that the lamp emits strongly with wavelength at 253.7 nm. This precisely falls into the UVC range and it is characteristic to electrically excited mercury atoms. What was interesting is that it takes only a thin sheet of glass (I used a 2 mm thick glass from photograph frames) to blocks completely the 253.7 nm and most of the 313.35 nm emission lines. This suggest typical glass can be used as a shield against such shortwave UV radiation. Note that the glass sheet also blocks a bit of near infrared light (from 700 nm towards 900 nm) but it let visible light (400 to 700 nm) passes without any blockade.

UVA (365.49 nm line) cannot be blocked by ordinary glass. 

Figure above shows the emission line of the germicidal lamp in the ultraviolet regime. We can see other than 253.7 and 313 nm peaks, one relatively strong peak is with wavelength around 365 nm. These fall into the range of A-subtype (UVA) ultraviolet which the glass sheet did not block it as effectively as it does to UVC radiation. 

Now, moving on to the biological hazards of using this lamp. As we know, ultraviolet radiation is the kind of light that people normally say it is harmful to our unprotected skin and eyes. From the guidebook: Hazards of Optical Radiation by McKinlay et. al. (1988) it states germicidal lamps are very efficient source of UVC radiation with approximately 50 % of the 11 watt electrical energy being converted to light, where up to 95 % (depending on the pressure of mercury vapour inside the tube) is emitted in 253.7 nm line. The monochromaticity of these source of light and the biological efficacy when the light is shine on it made these lamps hazardous, if used carelessly. 

 Observing filament heating to provide thermionic electrons for impact ionization to start a mercury-vapour plasma

Failure to observe exposure safety using these light can result in unintended biological damages. The most significant damage will be on the eyes, which I have a personal story to tell. When I bought the lamp, I knew  germicidal lamps being an excellent UVC source, its 253.7 nm photons can actually breakdown the molecular bond of oxygen in our atmosphere, producing ozone gas. Now ozone gas has its distinctive "musty" smell, so I was quite curious to observe this effect. Plus, turning on the lamp the first time to observe the glowing cyan plasma (picture above)  is quite fascinating itself. I can't help but to look closer at the filaments (the ones similar to incandescent light bulbs) as it heats up providing thermal electrons to "knock off" electrons in mercury atoms creating cascade of "knock offs" in more and more mercury atoms until the formation of the cyan plasma.

During the process of observation, I wasn't wearing any protective glasses. It only takes a while, less than 10 seconds of direct exposure, the distinctive smell of ozone is obvious. I used a powerful rare-earth magnet to bend the shape of the plasma (which I will provide a detail account later) and that was the end of observation. The observation was in the late afternoon and there are no acute symptoms immediately after exposure.

Couple of hours later around 4 am, I must have entered REM sleep which the movement of my eyeball start to trigger immense pain and irritation within both my eyes. It felt like grains of sand trapped underneath the eyelids but there was of course no sand. The tears produced (epiphora) was very profuse and rubbing the eyes seems to make matters worse. It was quite a frightening experience especially when I have no idea it was due to exposure of UVC radiation. Sensation of pain gains progressively worse after waking up and the only way to relieve it from getting worse is to close the eye and prevent any eyeball motion. Immediately, I was rushed to the emergency where I was laid down and flushed to the eyes copious amount of saline. After thorough flush-out, they did not find any contaminants but the pain was slightly relieved and I am able to forcefully open my eyelids, which all point light sources now appears to be fuzzy diffused spots. 

It was 6 am in the morning. The emergency sent me to ophthalmology dept. for diagnosis. About 2 hours later, just before examination, the pain returns and I was given a temporary eye-drop anesthesia, which works in immediate effect. Ophthalmologist couldn't find the irritant (of course) but based on observation told me I had a mild eye-infection, following prescription of anti-inflammatory eye-drops.  
The healing was rapid. In fact, without application of the medication, the pain was significantly relieved in less than 48 hours after hospital diagnosis. After a second separate incident (of a much smaller scale) I come to realize the source to the incident was my germicidal lamp. 

Because the naked eye was not protected against the bright 253.7 nm light (which is invisible, mind you). Much of it was absorbed by the first layer of the exposed eye, i.e. cornea and the conjunctiva. The injury of the cornea from UVC radiation is photochemical: unlike our skin which react to protect UV exposure by secretion of melanin, (the pigment that turns us tan under the sun) the cornea have no cellular components for releasing chemicals to protect itself. As such, the damage was directly a result of light-induced cellular death to the epithelial cells of the cornea (photokeratitis) and if the damage extend to the epithelial cells of conjunctiva (photoconjunctivitis). Full recovery can be expected in about 2 days which is the normal life-time of the epithelial cells of the cornea. Experiments on rhesus monkeys by Zulich (1980), shows the threshold radiant exposure for corneal injuries range from a few J/m^2 at 260 nm to 10,000,000 J/m^2 at 380 nm. 

Because UVC radiation from germicidal lamps are so bright, I also want to add that I have observed minor skin-peeling on my face a few days after close direct exposure, especially on soft epidermis near the eyes. This the same mechanism exhibited in sun-burned skin and to make matters worse, there is a slightly increased risk of skin cancer in exposed part due to the interruption of DNA chain inside the skin from energetic UVC photons.

In short, I just want to emphasize and I can never express it enough with the safety on working with open-air germicidal lamps. Although the damage on human skin and eyes are very real and vivid to me, it should be noted that UVC radiation can be shielded and it must be under any circumstances. Germicidal lamp can be a very useful source of light for disinfection, sterilization even in mineral identification but proper precautionary steps must be taken to avoid unintended biological damages. 


13 November 2013

Experimental Proof of Planck's Constant using LED

I received a lovely book as a birthday gift from a friend whom I told once I was so keen to get myself a copy but couldn't afford at that time. Authored by a father-daughter duo, they are more than simple enthusiast for reproducing some of the greatest work in 20th century physics. Exploring Quantum Physics through Hands-on Projects really provides all the little ideas (and some not so little) for the home-experimenter to verify some of the important works in physics which has earned its pioneers their Nobel prize.

In this article, I'll give an account of an experiment I've done according to that was described in chapter 4. The basic principle discussed was quantization which the authors called "the core for quantum physics". In it, they described a simple but effective "visualization" of Planck's constant at work using LED of different colours. 

A simple circuit can visualize Planck's constant at work - proving quantization as part of nature's behavior.  

The theory suggest that a single coloured LED (not white) emit almost (but not quite) monochromatic light. Assuming they do, the energy required to generate particles of light (photons) streaming out of the LED, have energy described by simple equation:

E = hf = (hc)/wavelength , c is speed of light in vacuum

Which states the energy, E, of a single particle of light is directly proportional to its frequency under a physical constant called the Planck's constant, h. 

Now because the colour of light is associated with its wavelength (and hence frequency), not surprising it will require increasing amount of energy to power LED that generates light with short wavelength (or high frequency). The Prutchi duo indeed suggest the constant h can be approximated by measuring the wavelength (or frequency) of light and voltage required to "start" LEDs. This is only true by assuming the energy of the photon is a direct consequence of the electrons transit from a higher level to a lower level corresponding to the materials inside the LED:

eV = hf = (hc)/wavelength , assuming E = eV

where e is the charge of an electron and V is the voltage required to "switch on" the LED. 

I have five LED of different colour which I have their wavelength measured using an Ocean Optics USB spectrometer. The results were normalized for all the LED emissions and graphically represented below:

The spectral profile of LEDs. They emit light with one peak wavelength corresponding to their colour.  

Specifically, the spectral emission peaks are 631 nm, 595 nm, 561 nm, 527 nm and 456 nm giving uncertainty of 2 nm for spectrometer calibration. The wavelengths correspond to their appearance: red, orange, yellow-green, green and blue respectively. 

By connecting the LED in series with a potentiometer powered by a 9 V battery, the "switch on voltage" can be measured by placing a multimeter probe between the LED electrodes while adjusting the potentiometer such that the LED start to emit light. 

When I did the experiment, I found a major flaw in its argument. The authors of the book themselves explained that this method can only approximate the constant h due to the very nature of LED themselves. To say light emitted from electron transition due to externally applied electric potential inside the "active region" of the LED is an oversimplification of the real case. 

1. The emission of light, as I found, happens even in as low as 0.07 V. As long as the LED is properly connected to their terminals (sign not reversed), a slight potential difference across it will cause a tiny current flowing through the diode which cause it to emits light. 

2. When the voltage is increased to about 1 V, the LED gets progressive brighter and at 1.75 V for LED designated "red", the brightness suddenly increased indicating "switching on". This sudden "switch on" voltage varies with LED of different colour and it is the parameter which we measure. 

The two points above actually describes the character of a semiconductor diode which I will not explain its operating mechanism in detail. Briefly, the wavelength of light emitted is actually dependent on the band-gap energetics of the materials between a p-n junction. The voltage I measured was actually the "forward bias voltage drop, Vd" corresponding to the point when the voltage-current curve starts to exhibit exponential behavior. 

Photograph taken by myself showing the "active region" in a green LED. Notice the tiny bright cubic crystal sitting on the reflective cavity supported by the cathode anvil "flag". Two thin wires connects the crystal are the cathode and anode providing energy (electric potential) to create light.

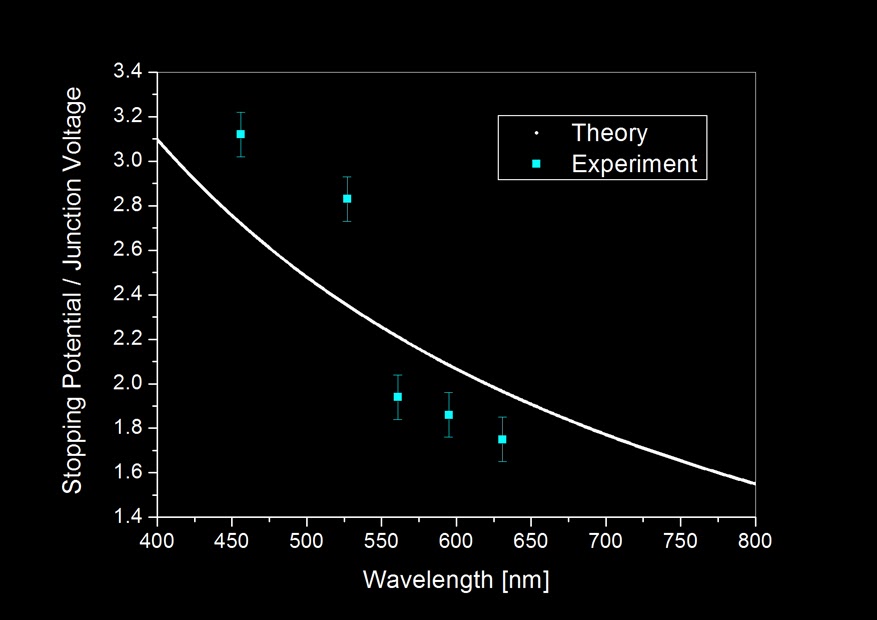
Nevertheless, I tabulated the data and plot a graph that include both a "theoretical" computation assuming [eV = (hc)/wavelength] and "experiment" points:


Notice how far the experiment results deviates from theory which assumes energy needed to generate light, E = eV even after including measurement uncertainties. But because 5 experiment points cannot statistically justify the trend, I calculated the Planck's constant, h, based on the result obtained from the 5 LEDs.


The average turns out actually not bad when compared to the actual value of Planck's constant: 6.626E−34 Js. Which differs only about 0.2% considering an experiment based on so many assumptions. It need to be noted that this apparently "good" result is also derived from statistics (since we averaged it), so given if we have more LEDs which emits light in wavelength other than the five I currently have, the "new" averaged result might not be so beautiful. 

This experiment tells us one important thing: that quantization of energy in the form of light, is detectable even in a slightly complicated solid-state system such as the LED. Different colours of light indicated by its frequency regardless of where it comes from, whether from our star, the lamp in our house to the screen we touch can be regarded as little "packets" of energy emitted from them. Each little "packet" is an energy signature that is in the multiple of Planck's constant. They typically enters our eye in huge numbers having different energy individually for different colours. These little particles or "corpuscles" as Sir Isaac Newton calls it, brought us a beautiful universe through a sensory perception we call sight. 


4 September 2013

Optical Phenomenon With a Glass Paperweight

Some time ago I saw a cubic glass paperweight for sale in Daisō. Everything in it was tagged with MYR 5 so I got myself a pretty deal knowing it could bring up some interesting optical tricks. It took me a while to get these photos posted up because I was looking in vain for an optimized camera setting to photograph a nice picture of total internal reflection demonstrated with this paperweight. 

Following the theory of geometrical optics based on Snell's law, a strong narrow beam of light (like from laser pointers) entering the cube should be totally reflected inside the cube, bouncing off at most at 3 internal surface and exit the cube to where it come from regardless of the angle of entrance. It is the basic operating principle of retro-reflectors. 

It worked physically when I tested it with a DPSS "green laser", but I find it difficult to capture it in photo for few reasons:


1. It is difficult to see the beam inside the cube because glass is transparent to light and thus did not provide media for light to scatter on. i.e. we can easily see the beam of a laser in a foggy day and not during clear summer nights. To overcome this problem is to increase the brightness of the laser beam or prolong exposure.

2. Some part of the laser light upon touching the glass cube will get reflected before entering the cube. these reflected light will be picked up by the camera under long exposure thus causing saturation. i.e. reflected light will cause saturation before the beam can be seen. 

3. To do long exposure photography, it is absolutely necessary to make sure the light source and the object doesn't move during exposure. Unfortunately, keeping the hand steady with laser pointer (I want to demonstrate non-normal angle of incidence) while holding your breath isn't going to work. 


So I gave up on that front, however I do have some other interesting photos coming from other optical phenomenon which is provided none other but this paperweight.

Diffraction pattern result from light transmitting through a microscopic air bubble trapped in glass

The picture above is one of them. I'd say it is a pretty interesting photo describing optical diffraction. What you are looking at was a beam of green light from a commercial laser pointer shining through an air bubble trapped inside the glass cube (I have digitally altered the hue). The spherical bubble is very small, I estimate its size no more than 0.5 mm, which became an object for the bright narrow beam of light to diffract on, thus creating the fringe pattern all around it. 

Actually, that singular photo shows multiple optical phenomena. Besides diffraction, we can also see refraction and also internal reflections. Can you find them all? 

*  *  *

Okay, laser beam aside. While I was trying to shoot the effect of a retro-reflector, I placed the paperweight on top of a piece of flat rectangular welding glass (from my previous experiment with haze particulates) in hope to increase the contrast for showing the beam reflecting inside the cube. Instead of the desired photographic effects, I found out there is actually a slight air gap between the cube and the welding glass even when the two objects are stacked together. 

White-light interference pattern created from path-difference between two interface 

Because both the surface of welding glass and glass cube are not optical-flats, the difference of thickness for the air gap between the two glass surface allows light wave to constructive and destructively interfere. And thanks to the black welding glass surface it dramatically brings up the interference pattern with bands of colour for each fringe indicating a polychromatic light source. Indeed, I was using typical fluorescent lamps to illuminate the setup.  

Under f/20 (f = 200 mm and small aperture for deeper depth-of-field), ISO-200, it took 3 second to expose the interference effect. This white-saturates the surrounding ugly table that supports the welding glass while keeping the object of interest in decent exposure.  

Inverse coloured fringes (top left) compared to previous image

It is interesting that when I orient the welding glass (without touching the glass paperweight on top) perpendicular to the previous orientation, the band of colour in each fringe got inverted but only for the case of "circle rings" and not the "X-bands" or "elongated-bands". I have yet to figure that out.

17 August 2013

Homemade Spinthariscope

Recently I was lucky to stumble across a local online store which sells ion chamber module for homemade smoke alarm projects. Without much hesitation I bought two of these chambers knowing they contain tiny amount of radioactive materials.

Yes, you heard right. I was looking for an ionizing radiation source for some of my hobby experiments and Americium is the only radioactive man-made element (of the periodic table) entered the common household as ionization source inside smoke detector alarms.

Now, I am not going to elaborate how ionization chamber works inside smoke alarms because it will digress from our current topic. What I was interested was extracting the ionizing source inside the chamber; and so I did.


The source was Americium-241 (the small embedded golden disc at the top of the plastic Petri dish), with major part of the radiation being alpha particles spitting out of the yellow metal (trivial part in gamma emission) with average energy of 4.5 million electron volts (MeV), factory spectroscopic evaluation full wave half maximum at 0.7 MeV. Because Americium-241 has a relatively short half-life of 432.6 years, each source contains less than 0.5 micrograms of americium dioxide has an activity of 0.8 microcuries which is equivalent to about 30,000 nuclear disintegration per second.

See, radioactive decay is a relatively energetic process. Literally chunks of matter in the form of alpha particles are being tossed out into the air from each decaying Americium atom (remember about 30,000 atoms are decaying at any moment) inside the golden alloy. After so, the fragmented Americium atom will become a Neptunium atom (also radioactive) which subsequently decay into other more stable elements. As a matter of fact, a 15 year old Americium source will contain about 5 percent Neptunium-237, which has a half-life of 2.14 million years.

Can we see this flying-in-the-air nuclear chunk? No. Even if we take this radioactive source and put it next to our eyes, we cannot see anything. No green glowing stuffs like we so often see in science fictions and cartoons. Radioactivity is invisible to our naked eyes but fortunately we have some other ways to make these energetic flying particles appear.

When alpha particle travel in air at great speed, in this case about 15,000 kilometres per second (based on 4.5 MeV relativistic kinetic energy) it has high probability to collide with anything that comes in their way due to its relative huge size. Usually these particles doesn't travel far, about 4 centimetres at most in air and will lose their energy in scattering events. It is like smashing a cue ball into a pool table full of billiard balls - eventually the cue ball will stop as it deposits its kinetic energy into the surrounding ball during collisions.

When collided in just the right way with the right materials, the passage of an alpha particle can be "seen". This is done with a process physicist call "scintillation". A transparent material such as phosphor powder (the stuff you get from old TV screens) will emit flashes of light when it is being collided by energetic moving particles.

TV phosphor powder in plastic container

More than two years ago, a friend of mine gave me an old TV which I have dismantled to get its high voltage components. I also collected some phosphor materials by scraping off the powder inside the glass TV screen. I had to gently break the glass by covering the entire TV tube with a damp cloth to avoid vacuum implosion, a hit with a hammer near to the electron gun will crack the glass allowing air to enter the tube.

From a glance, it seems the grain size of the powder is quite coarse, and indeed they were flaked off from the glass surface. Among the materials that was scraped out, it is a mixture of three types of phosphor and there is no way to isolate them. The three types of powder corresponds to red, green and blue light emitted if energetic particles such as electrons collide on it. More specifically, typical TV phosphor components are denoted P22R, component: Y2O2S:Eu+Fe2O3 glows red at 611nm, P22G, component: ZnS:Cu,Al glows green at 530nm and P22B, component: ZnS:Ag glows blue at 450nm.

Using a cellophane tape, I stick some some phosphor material from the container making sure only the finest powder was glued on the tape, then the phosphor coated tape was mounted on a washer providing a hole for the alpha particles to strike from the bottom (refer to first photo on top, lower part of the Petri dish).


What I am making is essentially a spinthariscope, an early device to visualize radioactivity. It has only three components. A radioactive source (my Americium-241 alpha emitter), a phosphor screen for the alpha particles to scintillate on and lastly a magnifying glass powerful enough to collect the faint light coming out from the cellophane tape. Here's the schematic:


Before looking at the cellophane tape with a magnifying glass (binocular eyepiece), I had to test and see if the tape was scintillating. So I hooked up my DSLR, turned off the lights in my room, putting sensor sensitivity to the maximum and gave it a 25 second exposure, and amazing result shows:


The blue spot was a collective exposure of individual flashes happening on the phosphor coated tape. Of course, without a magnifying glass we cannot see those tiny individual flashes but as a whole, the blue spot corresponds to the surface of phosphor powder where it was radially exposed to an Americium alpha source directly below it. I was pretty excited to see the individual scintillations, and I was lucky yet again that my father have an old Russian binocular for me to disassemble.

The eyepiece of the binocular has short focal length and it is a compound lens which behaves like a convex high-power magnifying glass. This is ideal to be part of the spinthariscope component as the lens should be placed as close to the screen as possible to avoid losses of light and act as a "light gatherer".


So I cap on the lens and look through it. Nothing. I did not see anything at first but it was no surprise, because each scintillation only result in emission of a few light particles (i.e. photons) and therefore the light should be very faint. But when our eyes adapted to the dark, it has higher capability to detect those faint flashes of light and will usually take about 15 to 20 minutes to reach that kind of sensitivity in darkness.

I found a video in YouTube features what we are able to see through a spinthariscope. Please be noted that the video uses a movable alpha source, therefore the centre of the activity seems to move around the field-of-view.


It sparkled with beautiful flashes of light, where each spot represent one alpha particle striking through the phosphor powder on the cellophane tape. I here provide a simplified schematic of the mechanism:


The active area of the spinthariscope is this: radioisotope Americium-241 emits alpha particles travelling in straight line towards the phosphor coated tape. When an alpha particle collide with the phosphor materials, each atomic collision provides one photon (one quanta of light) and it is extremely faint. But I once read that human eyes are sensitive to even 6 photons per rod photoreceptor cell, (scientific citation here) I suppose each flash should compose of more than that amount of photons coming from each alpha particles, which implies it is a multiple collision event happening to one alpha particle. 

Enchanting views aside, light from scintillations in my spinthariscope is rather weak and it takes time for our eyes to adapt darkness for observation. Leslie Wright managed to use a photointensifier tube, something you can get from night-vision goggles to multiply the photons coming out from the scintillations and it was bright enough to be recorded with a compact camera.  


The next stop is for me is to take a controlled long exposure photograph in varying distance between the alpha source and the phosphored tape. Perhaps I am able to visualize the inverse-square law and do some elementary calculation based on brightness to validate it. 

7 July 2013

Size Distribution of Sedimentary Haze Particulates via Monochromatic Diffraction of Light

Part of this article was adapted from my unpublished scientific paper. It was not submitted for publication due to an unfortunate turn in my methodology which yielded inconclusive results during analysis.

1°34'18.9"N, 103°37'14.9", 20 June 2013, 1014 local time

Recent agricultural burning and peat fires in the Sumatera and Riau islands has produced copious amount of carbonized dust and organic aerosols where its drift direction follows low level atmospheric dynamics. In mid June, the wind direction has brought Malaysia and Singapore the phenomena of haze where certain parts of Malaysia has reported record of 700 units in the Air Pollution Index (API). While heavy concentration of particulates within the atmosphere typically brings negative impact to the biological and ecological system to the affected region and thus population; the size and composition distribution determines the aerosol kinematics and consequently its duration in air.

The haze coincide with the occurrence of "super moon". Scattering caused the moon to appear redder than it should.  

According to Max-Planck Institute of Meteorology, atmospheric suspending particles range in size from 2 μm to 10 mm depending on different processes of particulate formation and its agglomeration. Ultrafine particles with diameter less than 1 mm has been characterized to have a high tendency of reaching into the lungs thus causing internal inflammation while particulate matter less than 2.5 mm can trigger respiratory diseases. 

In 2000, Emmanuel quantifies the Sumatran haze constitutes 94% particulates with diameter lesser than 2.5 μm using a scanning electron microscope. The immediate concern suspending matter in this size is that it could easily bypass biological defence mechanism, penetrating deep into the alveoli. Such fine particulate has been recognized by ASEAN haze action online as the result from soot-like material coming from wood-stoves, fireplaces and forest burning.

What I have been trying to do was essentially to measure the size distribution of the dust particles suspended in air which constitutes haze. Some time ago, I was informed that the industry have been using integrated systems incorporating optical diffraction for quick analysis of powdered particle sizes for quality sampling particularly in manufacturing processes such as the production of powdered milk. A quick thought came to me when the haze occurred so I went to my sketch book and started designing a simple method to measure the size of the haze particulates using my camera sensor as the image detector.

Figure obtained from sympatec.com

Optical diffraction occurs upon both apertures and opaque masks when they are irradiated by light. A monochromatic source should give rise to concentric rings diffraction patterns (figure above) upon a central airy disc emerged from uniformly illuminated opaque mask, i.e. a dust particle. This phenomena of optical diffraction is mathematically formulated under far-field (Fraunhofer) theory which for the case of a spherical (our assumption is that the haze particulates are taking a spherical geometry) dust, its radial size can be obtained by computing the approximation formula when the distance between the centre to the first minima of the Airy pattern, focal distance and wavelength of light are known.


So, adapting a modified glass body cap (photo above) from my solar pinhole experiment, I left it outdoor exposed to the haze for 2 hours on 22 June. Heavier dust particles tend to "settle down" when there is no wind current to carry it further in the air. After the collection, casual naked-eye observation of the glass plate shows numerous dust particles. In fact, even without purposely collecting it, my car windshield has been covered by a layer of dust coming from the haze. 

The body cap is then attached onto my camera (lens removed) and I allowed a beam of laser light, expanded using a cheap acrylic lens, to shine through the dust laden body cap into the sensor. Because laser has a relatively fixed wavelength, I used a 532nm DPSS (green) laser as my monochromatic light source and the distance between the glass lens-cap to the sensor has already been calculated from my running solar pinhole experiment so the only thing left was to measure the size of the Airy disc. 


The Airy patterns that was formed on my camera image plane was shown in the photograph above. Notice the green background which is the effect of using a DPSS light source. Each particulate should, form only one Airy pattern; collectively, the particles create diffraction patterns and they are scattered all over in the photo. 


So we took a sample of 150 Airy patterns by measuring their width and then crunch in the numbers with Excel. The histogram above shows the size distribution of the particulates. It should be noted that the size are quite large compared to the average "colloidal" particles suspended in haze. At a glance, it seems to agree with the particles seen on the body cap because it was essentially macroscopic! However, later data acquisition using the same body cap (washed and scrubbed with alcohol and organic solvents) still produced similar diffraction patterns, rendering this statistics unreliable. 

Putting failure aside, I still managed to capture some "souvenir" pictures of the haze related to optical sciences. In particular, it is scattering. Tiny dust particles can scatter blue light away, leaving the red part transmitting through. This was the essence of my previous "Scattering in Milk" demonstration and we now can see why haze is also a form of colloid, similar to milk. Because blue light has been scattered, when we look into the haze, it should appear slightly bluish against a dark background. This was exactly what I did with the dust particles. 

Shining light (white L.E.D) horizontally on welding glass with haze particulates 

Parallel to the diffraction experiment, I placed alongside a piece of welding glass next to my glass lens cap for dust collection. The welding glass provides a dark background when dust which sits on it was illuminated with a white L.E.D across its surface. The scattered blue light was obvious and the result was remarkable as I have never seen how something as sickly as the constitution of haze, capable of producing a painting of stars.  


Careful configuration of the light source using two L.E.D shining the dust from both horizontal sides to the welding glass produce a picture that is similar to a milky-way masterpiece from an astrophotographer. This effect is largely contributed by Rayleigh scattering and to remove the "stars", simply change the angle of illumination. The photograph below shows how the effect "turns off" when the welding glass was illuminated by the same light but parallel to the surface.